Edit chart
Loading graph
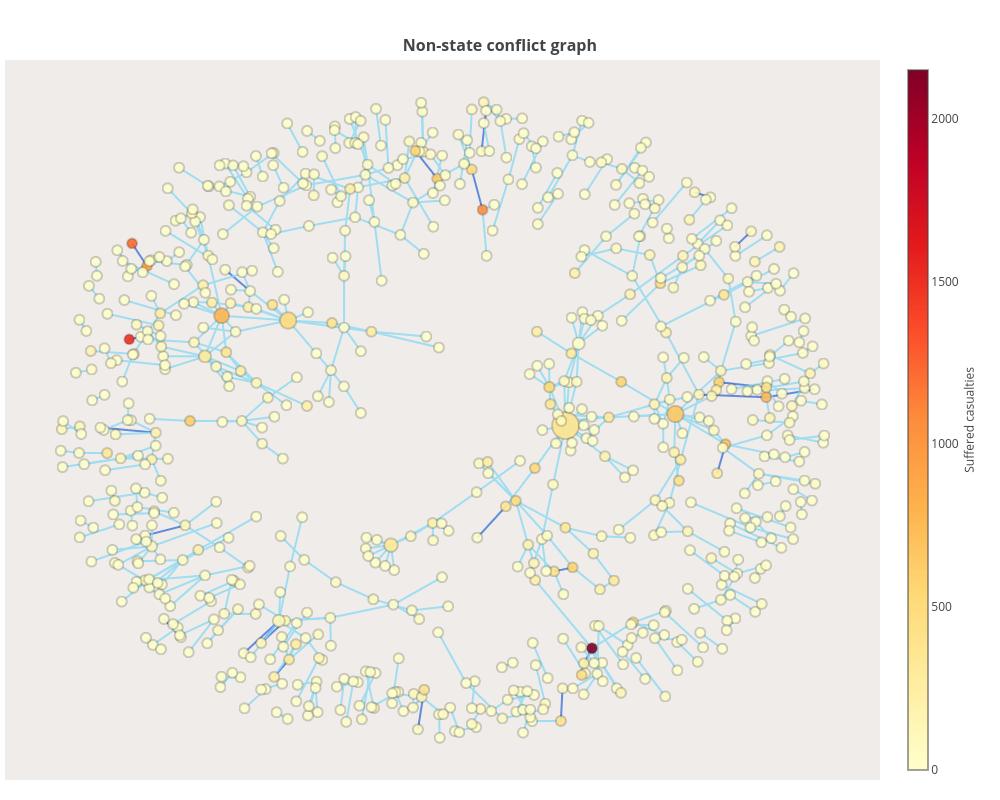
Vikjan94's interactive graph and data of "Non-state conflict graph" is a line chart. The x-axis shows values from -1.1454710971498272 to 1.1403169047021648. The y-axis shows values from -1.1279324402403963 to 1.1169140448165071.